Dashboard
The dashboard is the first page the manager sees after logging in. It provides a real-time view of service activity: what is scheduled today, what is overdue, who is available and where stock levels stand. It is your starting point for running the day.
When to use it: every morning to frame the day, and at any time to check the state of the service at a glance.
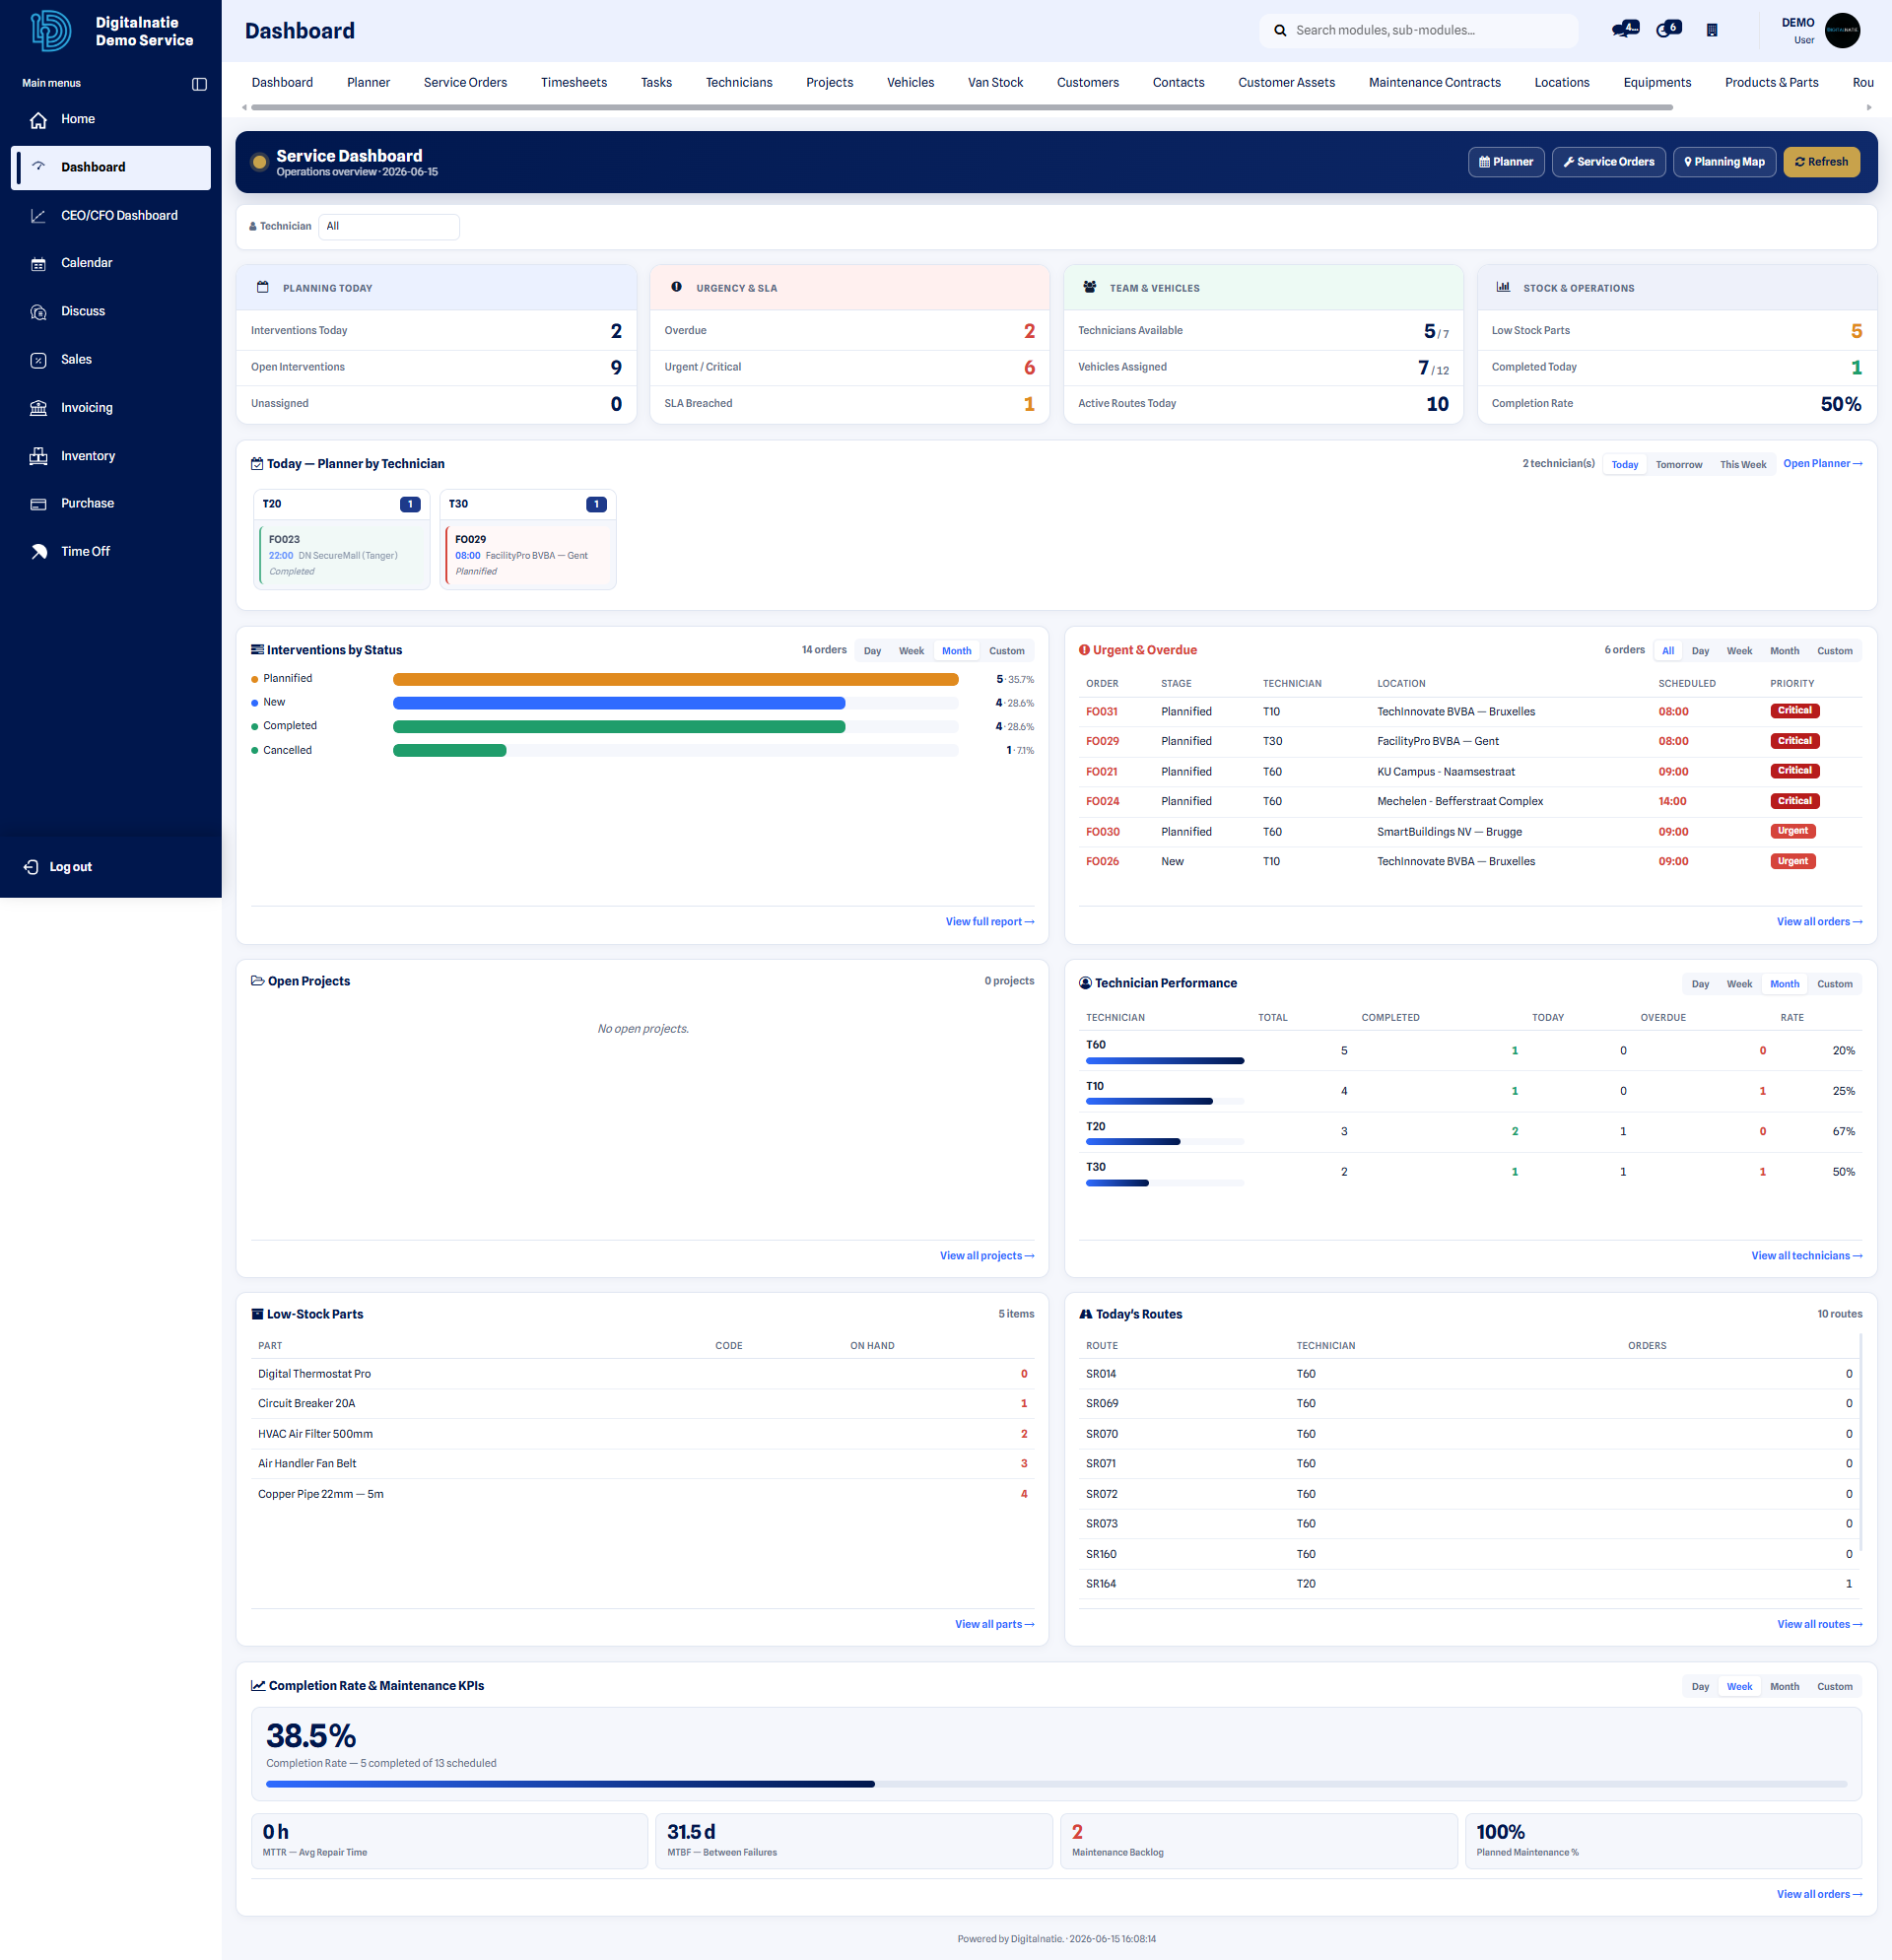 Dashboard: real-time indicators of service activity.
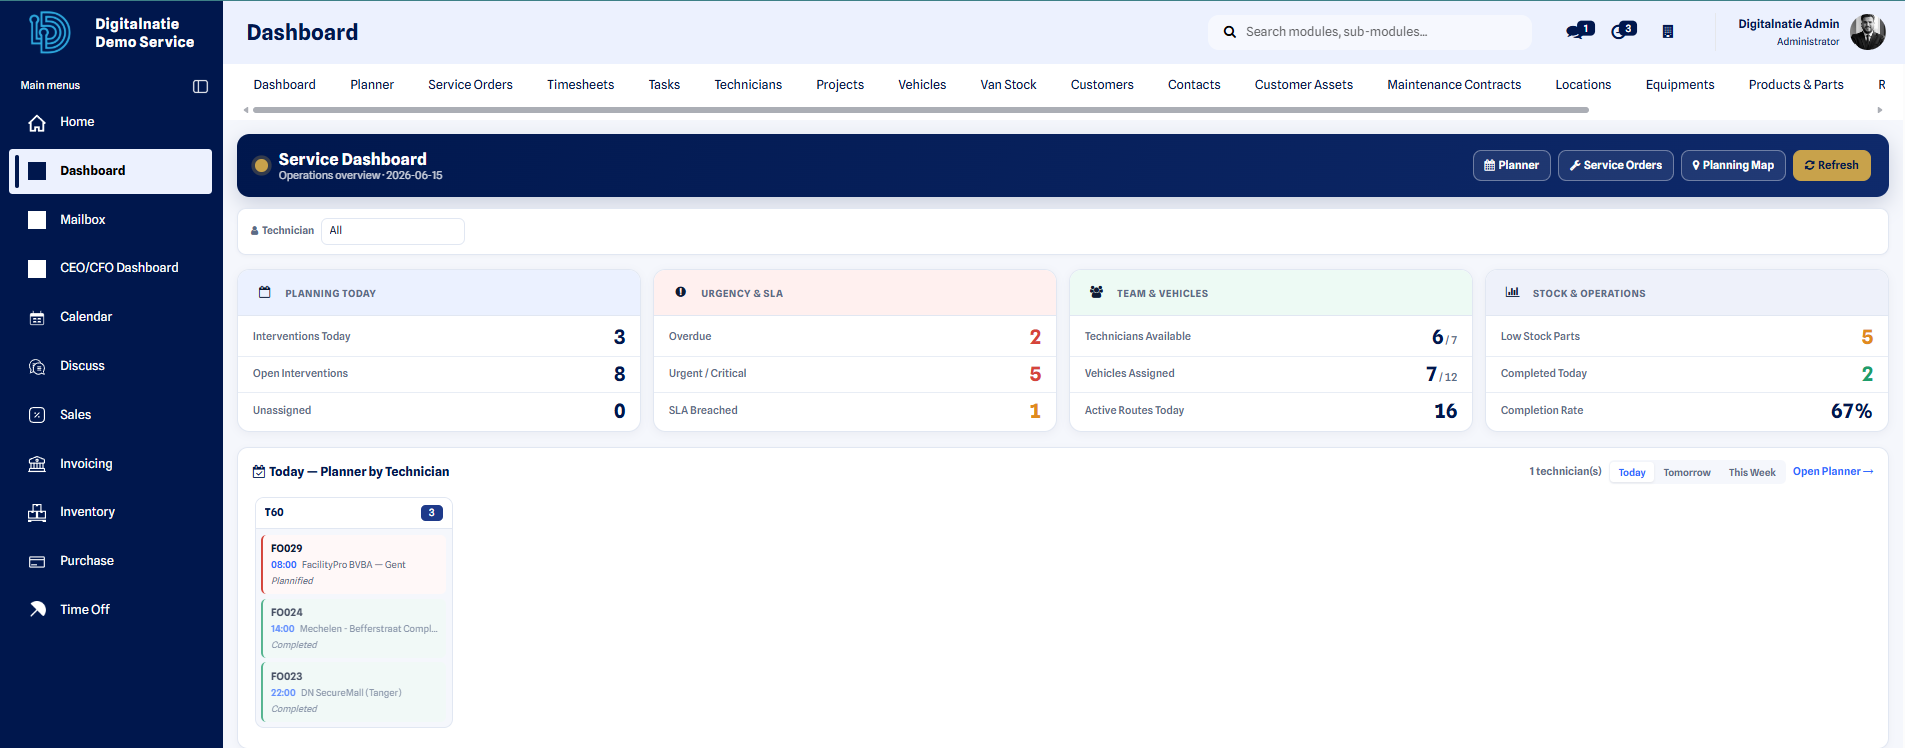 Key areas: today’s scheduling, urgent jobs, team availability and stock.
The four key areas
Section titled “The four key areas”Today’s schedule
Section titled “Today’s schedule”A list of the jobs scheduled for today: planned time, customer, assigned technician and location. It shows you the day’s workload and lets you quickly spot an empty slot or an overloaded technician. To rearrange the day visually, open the Planning.
Urgency & SLA
Section titled “Urgency & SLA”Highlights overdue jobs, priority orders and the deadlines to meet (service commitments). Handle this area first: it flags what is at risk of going off track and needs to be reassigned or brought forward.
Team & vans
Section titled “Team & vans”Shows the availability of technicians and vans: who is free, who is already in the field, which van is in use. Useful for assigning a new job without creating a conflict. See also the Technicians page.
Stock & operations
Section titled “Stock & operations”Gives an overview of stock levels, available parts and replenishment needs. This lets you spot a missing part before it blocks a job.
Using the filters
Section titled “Using the filters”Each indicator and each area can be displayed as a filtered list to drill down into the detail.
- On the dashboard, click on the indicator or area you are interested in (for example Overdue jobs).
- The corresponding filtered list opens, already restricted to the chosen criterion.
- Refine further if needed using the filters at the top of the list (technician, customer, date, priority).
- Click on a row to open the service order and act on it.
Result: you go from the overview to the precise list of relevant orders in one click, without re-entering any criteria.
Stage or Technician status?
Section titled “Stage or Technician status?”Two different tracking systems appear on service orders:
- Stage (overall order status): tracks the life cycle on the management side — New, Scheduled, Done, Cancelled.
- Technician status (field tracking): tracks actual progress in the field — Scheduled, On the way, On site, In progress, Break, Done, Cancelled.
Quick access
Section titled “Quick access”From the home page, you reach the most frequently used spaces in one click: service orders, projects, technicians and customers.
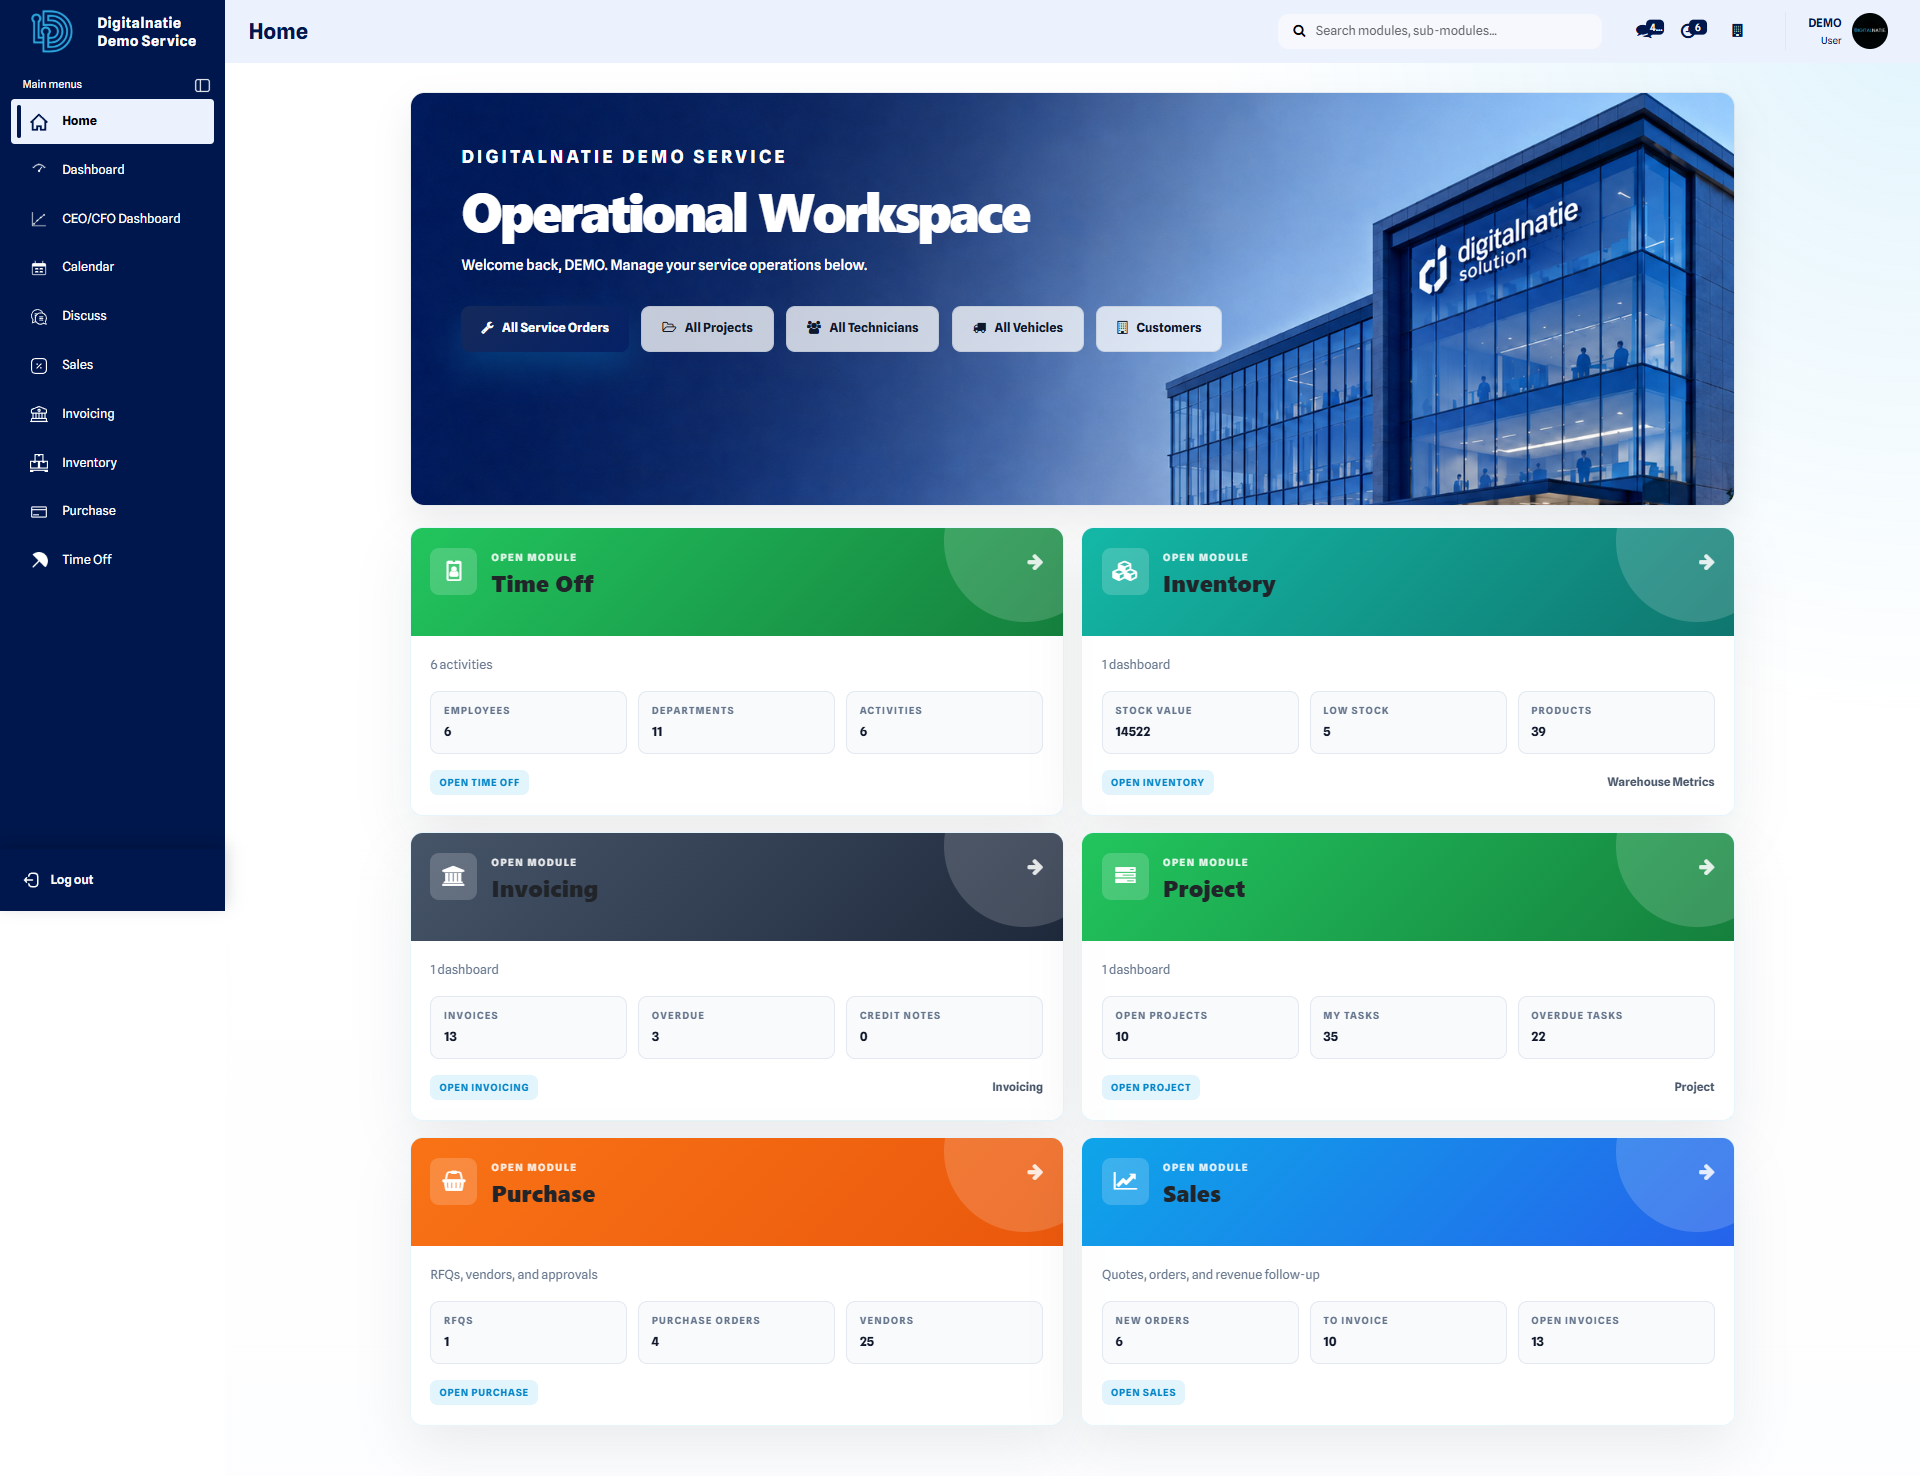 Home page: shortcuts to service orders, projects, technicians and customers.
Notifications
Section titled “Notifications”The notifications icon, at the top of the interface, flags new messages, the tasks assigned to you and the updates to your records. A badge indicates the number of unread items.
- Locate the notifications icon at the top of the screen (a badge shows the number of unread items).
- Click the icon to open the notifications panel.
- Browse the new items — messages, tasks, updates — and click an item to open it.
- To receive alerts, allow browser notifications when prompted to do so.
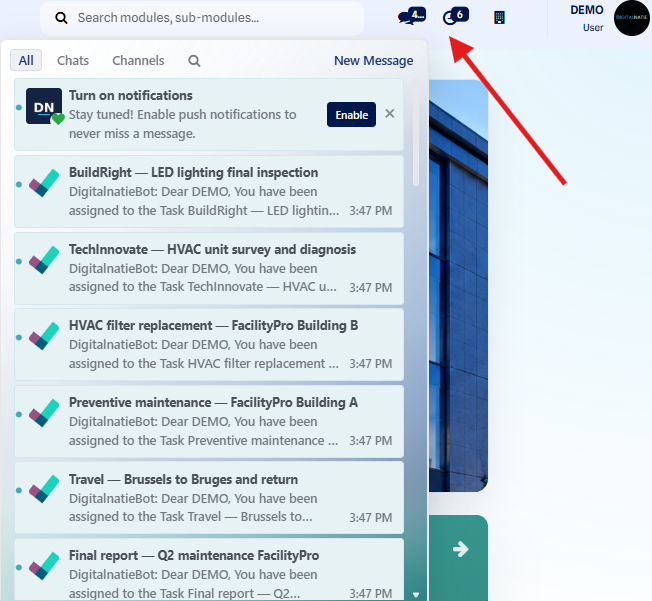 The notifications panel brings together your new messages, tasks and updates.
Result: you keep track at a glance of the assigned tasks and the important updates, without missing anything.
In-depth analysis
Section titled “In-depth analysis”The dashboard gives the picture of the moment. For analysis over time (by technician, by customer, by period), see the Reports page.