

Service network map
The Service network map lets you descend from region to technieker, customer, site and asset, with signals about warranty, contracts and open invoices.
What you use this for
Section titled “What you use this for”- Checking which customers and assets fall under a region or technieker.
- Preparing a region for handover to another technieker.
- Spotting regions with many assets and few techniekers.
- Creating a service order from an asset, with a pre-filled form.
Who can use it
Section titled “Who can use it”| Role | What they do |
|---|---|
| Service manager | Reviews the spread and prepares handovers |
| Planner or dispatcher | Looks up customers and assets per region |
Prerequisites: every customer needs sites, and those sites a postcode or town — otherwise the customer lands under no region. The map is read-only and internal only; no amounts appear on it.
Walking the map
Section titled “Walking the map”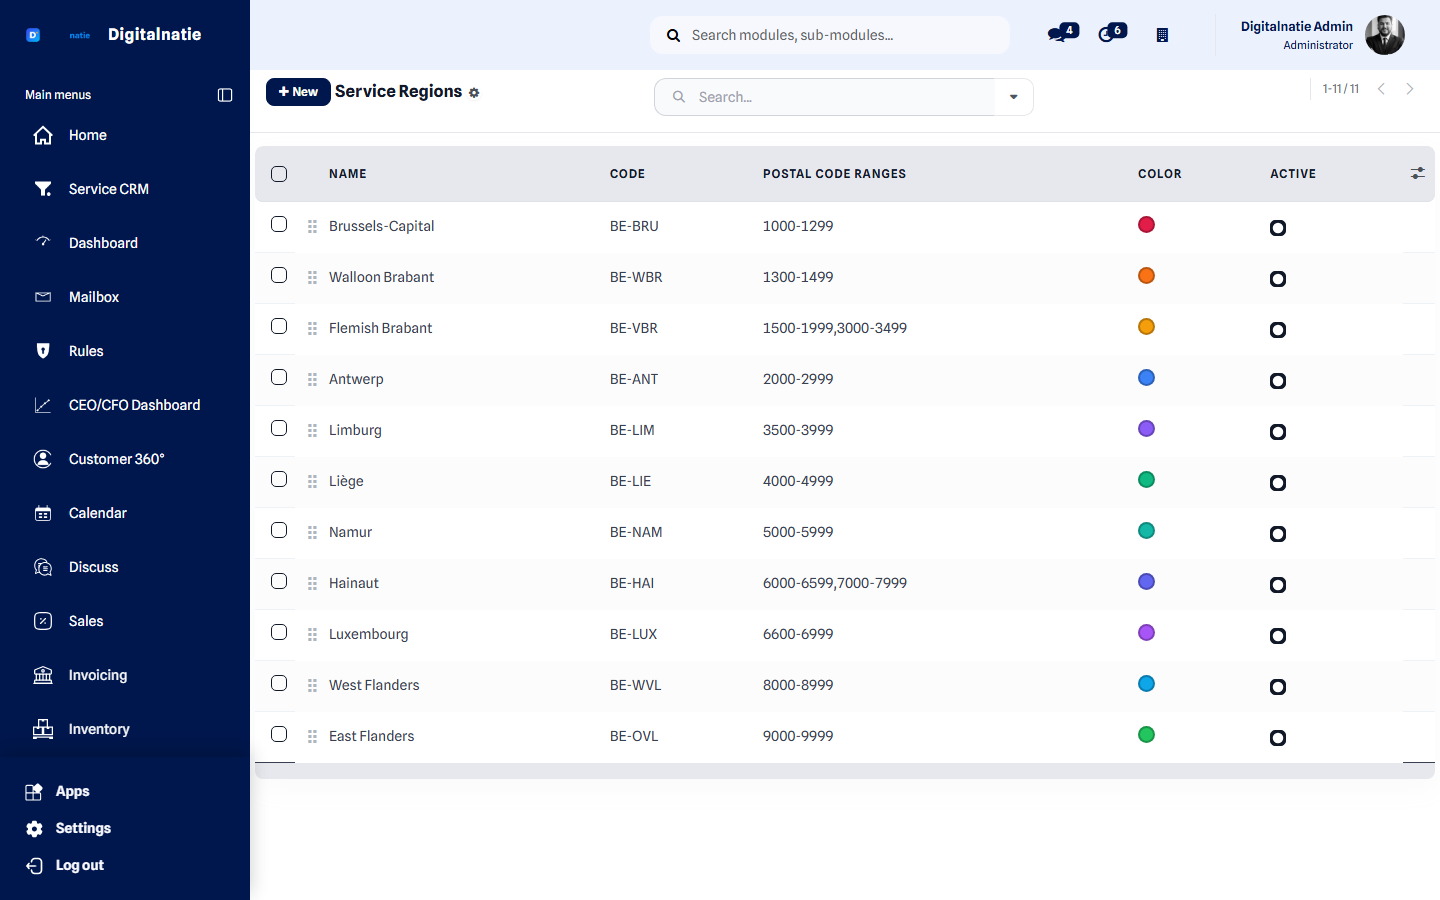 The regions your network is divided into, each with its postcode ranges and colour.
You descend step by step, and only what you open gets loaded:
Region ─▶ Techniekers ─▶ Customers ─▶ Sites ─▶ Assets ─▶ Service historyAt every level you see counts, and one click opens the real document.
Regions
Section titled “Regions”Regions are configurable. If you have configured nothing, the system derives the region from the postcode — the Belgian provinces are ready on installation — and otherwise from the town.
The signals on the map
Section titled “The signals on the map”Besides names and counts, the map shows signals that help you prioritise:
| Signal | What it tells you |
|---|---|
| Service history | How many interventions have already taken place |
| Warranty | Whether an asset is still under warranty |
| Maintenance contract | Whether there is a running contract |
| Risk estimate | Derived from readiness |
| Open invoices | Only the count, as a signal |
What you do with it
Section titled “What you do with it”-
Open the Service network map and pick a region.
-
Look at which techniekers are active there and which customers fall under it.
-
Descend to a site and its assets.
-
Open the asset, or create a service order from there — the form opens pre-filled.
Important to know
Section titled “Important to know”- The map is read-only and internal only. There is no public access.
- Every relationship comes from real data: interventions, sites, assets, techniekers and customers. No links are invented.
- The map sends no emails, changes no statuses and assigns nobody. The only action is open a document or open a pre-filled form.
- Of invoices you only see a count of open ones — no amounts. Amounts live in the Customer File 360°, behind financial rights.
Best practices
Section titled “Best practices”- Configure your own regions if you don’t work by province. Deriving from the postcode is a safety net, not a business structure.
- Use the map in the annual review with techniekers. Their region, their customers, their assets — that is a concrete conversation.
- Look for the blank spots. A region with many assets and few techniekers is a risk you can see today.
- Check that every customer has sites. A customer without sites drops out of the map, because there is no location to hang them under.
Troubleshooting
Section titled “Troubleshooting”Can a customer see this map? No. It is strictly internal.
Does the map change my data? No, except that you can open a pre-filled form from it — which you still have to save yourself.
Why is a customer under no region? There is no usable postcode or town. Complete the site’s address.
Do I see amounts here? No, only the count of open invoices, as a signal.
Does the map work with multiple companies? Yes, you only see what falls within your access.
Next step
Section titled “Next step”- Customer File 360° — the same story per customer
- Sites — structuring locations
- Asset Intelligence — health per asset
- Techniekers — who drives where
- Routes — rounds and areas
- Maintenance contracts — running contracts