

Asset Intelligence
Asset Intelligence measures per asset how often and how long it is down and what maintenance costs, and combines that into a health score from 0 to 100 that you can explain component by component.
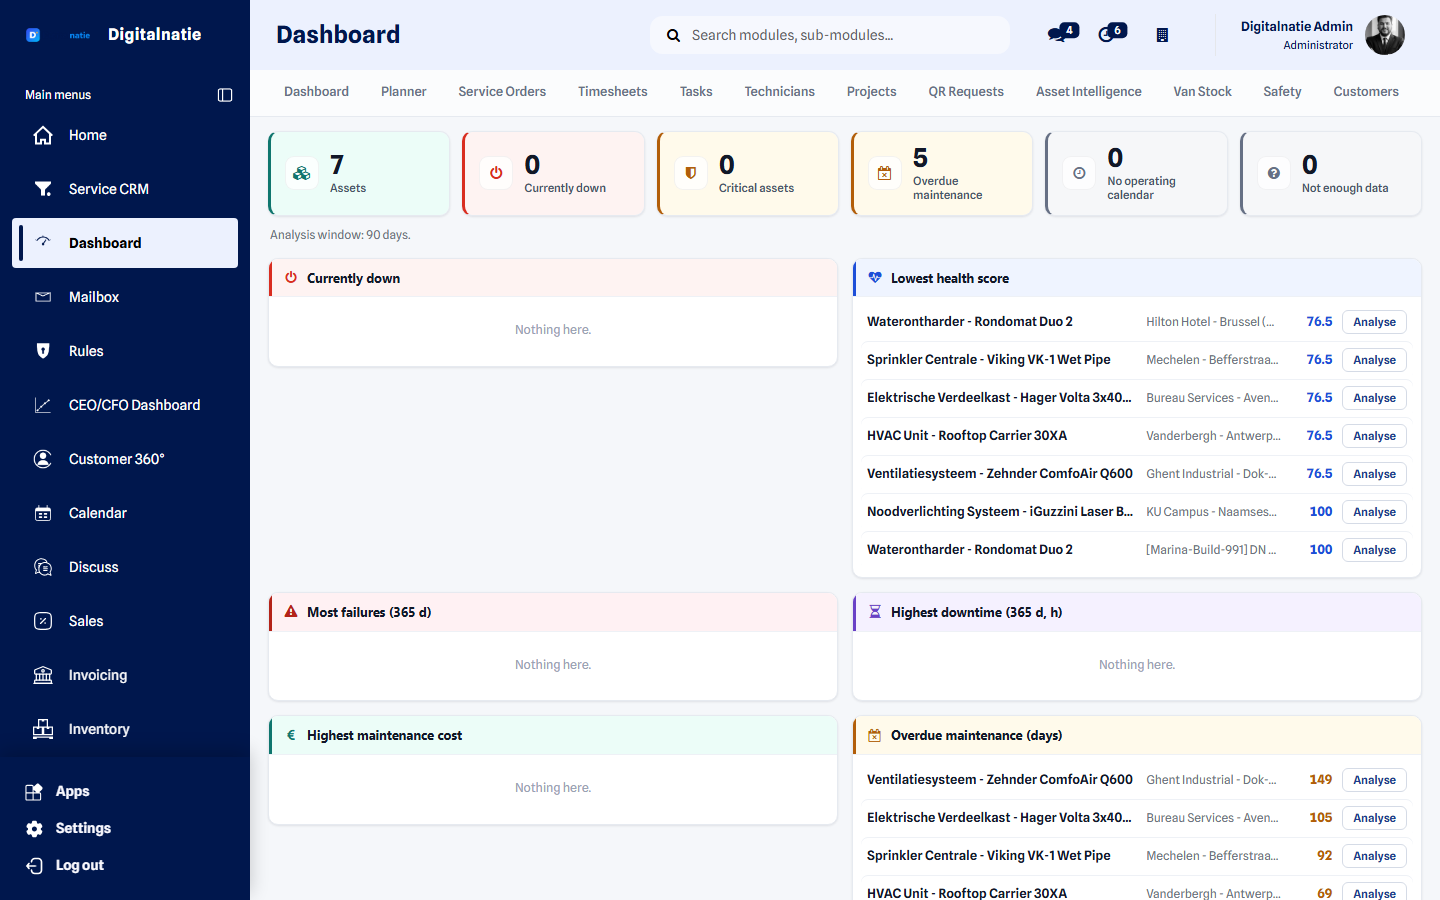 The health score per asset, with the reason behind it.
What you use this for
Section titled “What you use this for”- Deciding which assets need attention first.
- Backing up with figures why an asset is better replaced.
- Tracking availability, MTBF and MTTR per asset.
- Following maintenance costs and comparing them with the previous period.
- Splitting a large installation into line, machine, subassembly and component.
Who can use it
Section titled “Who can use it”| Role | What they do |
|---|---|
| Service manager | Manages the hierarchy, reads the scores, sets the weights |
| Technieker | Records downtime in the app while working |
| Owner | Uses the dashboard to prioritise the fleet |
Prerequisites: interventions must be attached to an asset and techniekers must record downtime — without both, the score stays empty. Maintenance costs are only visible with financial rights. Configure an operating calendar for assets that don’t run continuously.
The equipment hierarchy
Section titled “The equipment hierarchy” Site, production line, machine and component nested.
An industrial installation is not a flat list. Asset Intelligence lets you nest equipment:
Site└── Production line └── Machine └── Subassembly └── ComponentEach level shows its own figures and the combined figures of everything below it, without double counting. That way you see whether a production line underperforms because of one component or across the board.
You manage the hierarchy through the Parent asset field on the asset record, or visually in the hierarchy explorer.
Recording downtime
Section titled “Recording downtime”Downtime is the basis of every reliable figure. It is recorded on the intervention — not in a separate notebook — so it always traces back to a real work order, customer, site and asset.
| Type | When |
|---|---|
| Unplanned downtime | A breakdown: the asset stops during production |
| Planned downtime | Maintenance you agreed in advance |
A technieker starts and stops downtime directly in the Technician App. Recording is idempotent: pressing start twice does not create a second downtime.
The metrics
Section titled “The metrics”| Metric | What it tells you |
|---|---|
| Breakdown count | How often this asset failed within the analysis window |
| Downtime (planned / unplanned) | How many hours the asset was unavailable |
| Availability | Percentage of planned operating time the asset actually ran |
| MTBF | Mean time between failures — higher is better |
| MTTR | Mean time to repair — lower is better |
| Maintenance cost | Parts + labour + external costs |
| Overdue maintenance | How many days a planned service is late |
| Repeated failures | The same complaint that keeps coming back |
The health score
Section titled “The health score” The score and the Why this score block, with the point loss per component.
The score runs from 0 to 100 and is built from five weights you can configure yourself:
| Component | Default weight |
|---|---|
| Failure frequency | 30 % |
| Downtime and availability | 25 % |
| Overdue maintenance | 20 % |
| Maintenance cost trend | 15 % |
| Repeated failures and current state | 10 % |
The score is translated into a readable status:
100 ─────── 85 ──────── 70 ──────── 50 ─────── 0 Excellent │ Good │ Attention │ CriticalWhy this score?
Section titled “Why this score?”The asset record contains a Why this score block listing every point loss. For example: “Failure frequency: 3 failures per 30 days → −24 points.” You can literally read the score out to a customer.
Honest about missing data
Section titled “Honest about missing data”A component without usable data is not guessed: it drops out and its weight is redistributed over the others. If too much data is missing (by default less than 50 % of the weight), the system publishes no score rather than a misleading figure. A data-quality indicator always shows how solid the score is.
The manager dashboard
Section titled “The manager dashboard” The fleet ranked by health, with breakdowns and downtime.
Besides the per-asset record there is a dashboard ranking your entire fleet: the weakest scores at the top, with breakdown counts and downtime alongside. That way you know every Monday morning where to look first.
History is kept in snapshots: the system periodically records each asset’s score so you can follow the trend over months instead of only today’s state.
Best practices
Section titled “Best practices”- Build the hierarchy properly once. Everything hangs off it. Start with the site, then the line, then the machine — not the other way round.
- Have techniekers record downtime in the app, not at the office afterwards. Hours reconstructed later are estimates — and estimates make every metric worthless.
- Configure an operating calendar for assets that don’t run continuously. Without one you are comparing apples to oranges.
- Adjust the weights to your sector. In production, downtime weighs heavier; in rental, maintenance cost does.
- Check data quality before you use a score in a customer conversation.
Troubleshooting
Section titled “Troubleshooting”Does the score use AI? No. It is a fixed, recalculable formula. The same data always gives the same score. For AI support on reports, see the AI Report Assistant.
Why does my asset have no score? There is too little usable data. Record downtime during interventions and the score appears once the threshold is met.
Does planned downtime count against my availability? By default no — planned maintenance is not a defect. You can switch that in the settings.
How deep can the hierarchy go? As deep as you need. In practice four or five levels is plenty.
What is a good MTBF? That depends entirely on the sector. Use your own history as the benchmark: one asset’s trend over time says more than an absolute standard.
Next step
Section titled “Next step”- Customers & assets — creating and managing assets
- Asset QR codes — scanning a device on site
- Customer File 360° — assets in customer context
- Maintenance contracts — planning preventive maintenance
- Scan asset & downtime — the app side
- Service network map — walking the fleet visually