Reports
Reports give you an analytical view of your activity, beyond the dashboard: intervention volumes, technician workload, revenue and parts consumed.
When should you use them? To track performance over a period, prepare a team meeting, or justify invoicing and parts consumption.
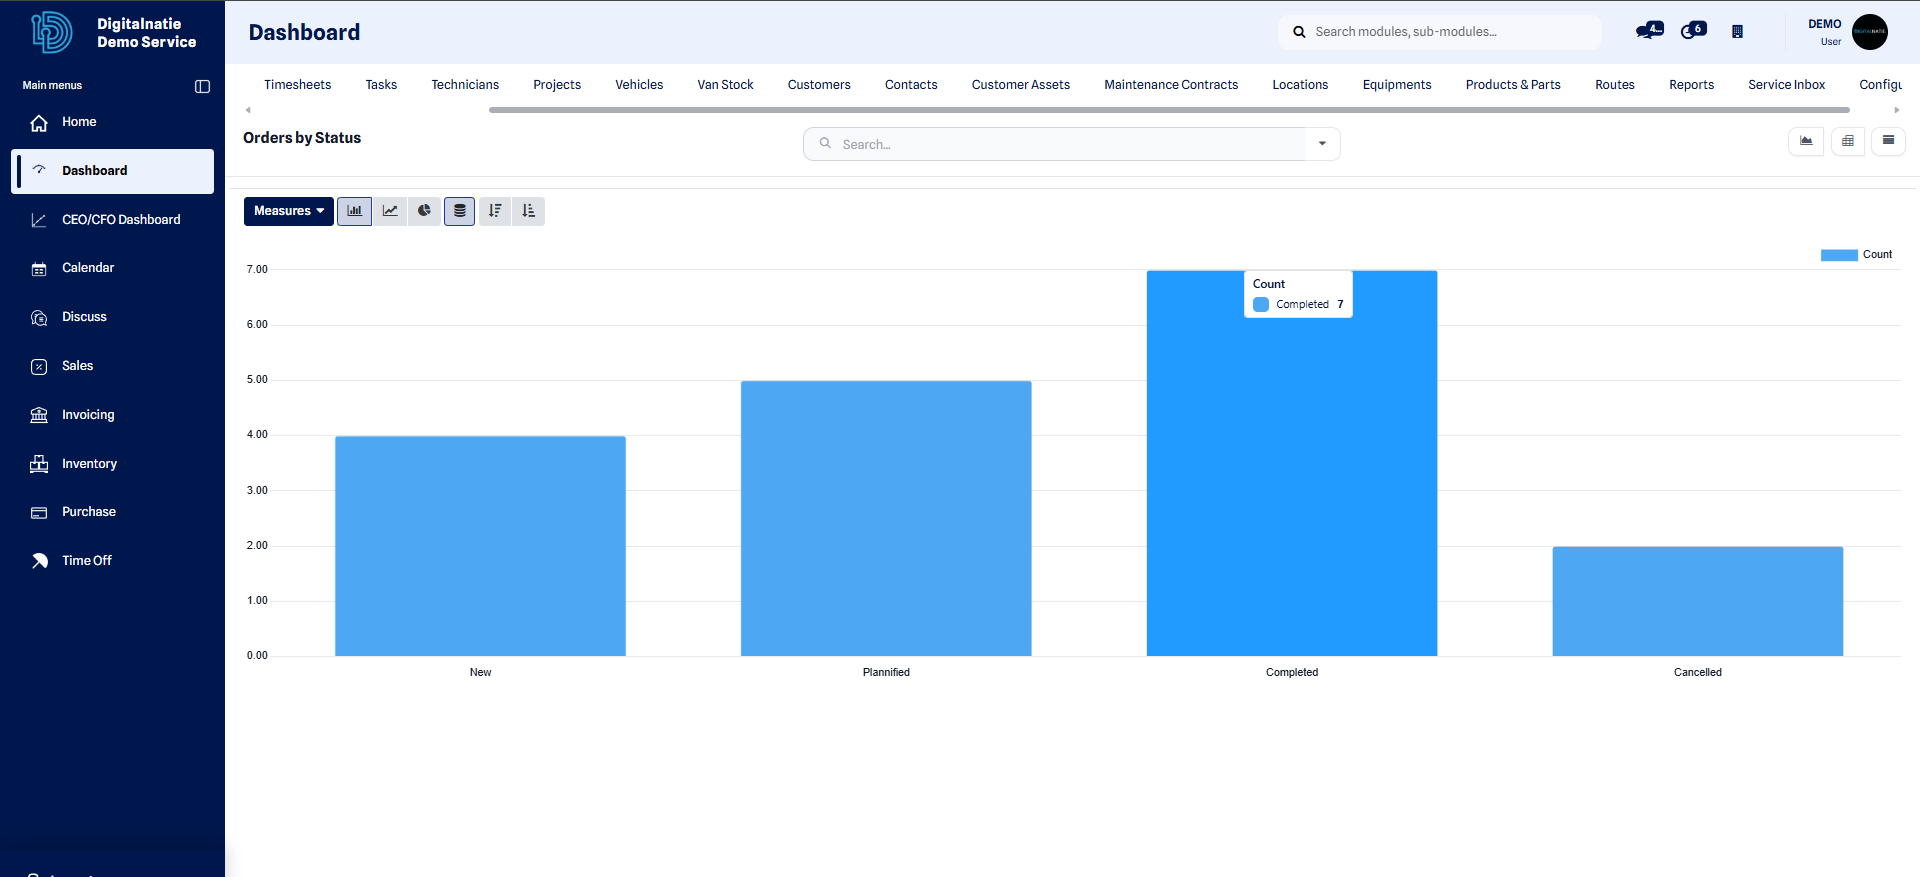 Global analytical view: volumes, statuses and trends over the selected period.
Available analyses
Section titled “Available analyses”| Report | What it shows |
|---|---|
| Interventions | Volume, statuses, delays by period |
| By technician | Workload, logged hours, closed interventions |
| By customer / asset | Intervention history and frequency |
| Revenue | Amounts invoiced by period |
| Parts consumed | Items used, valuation |
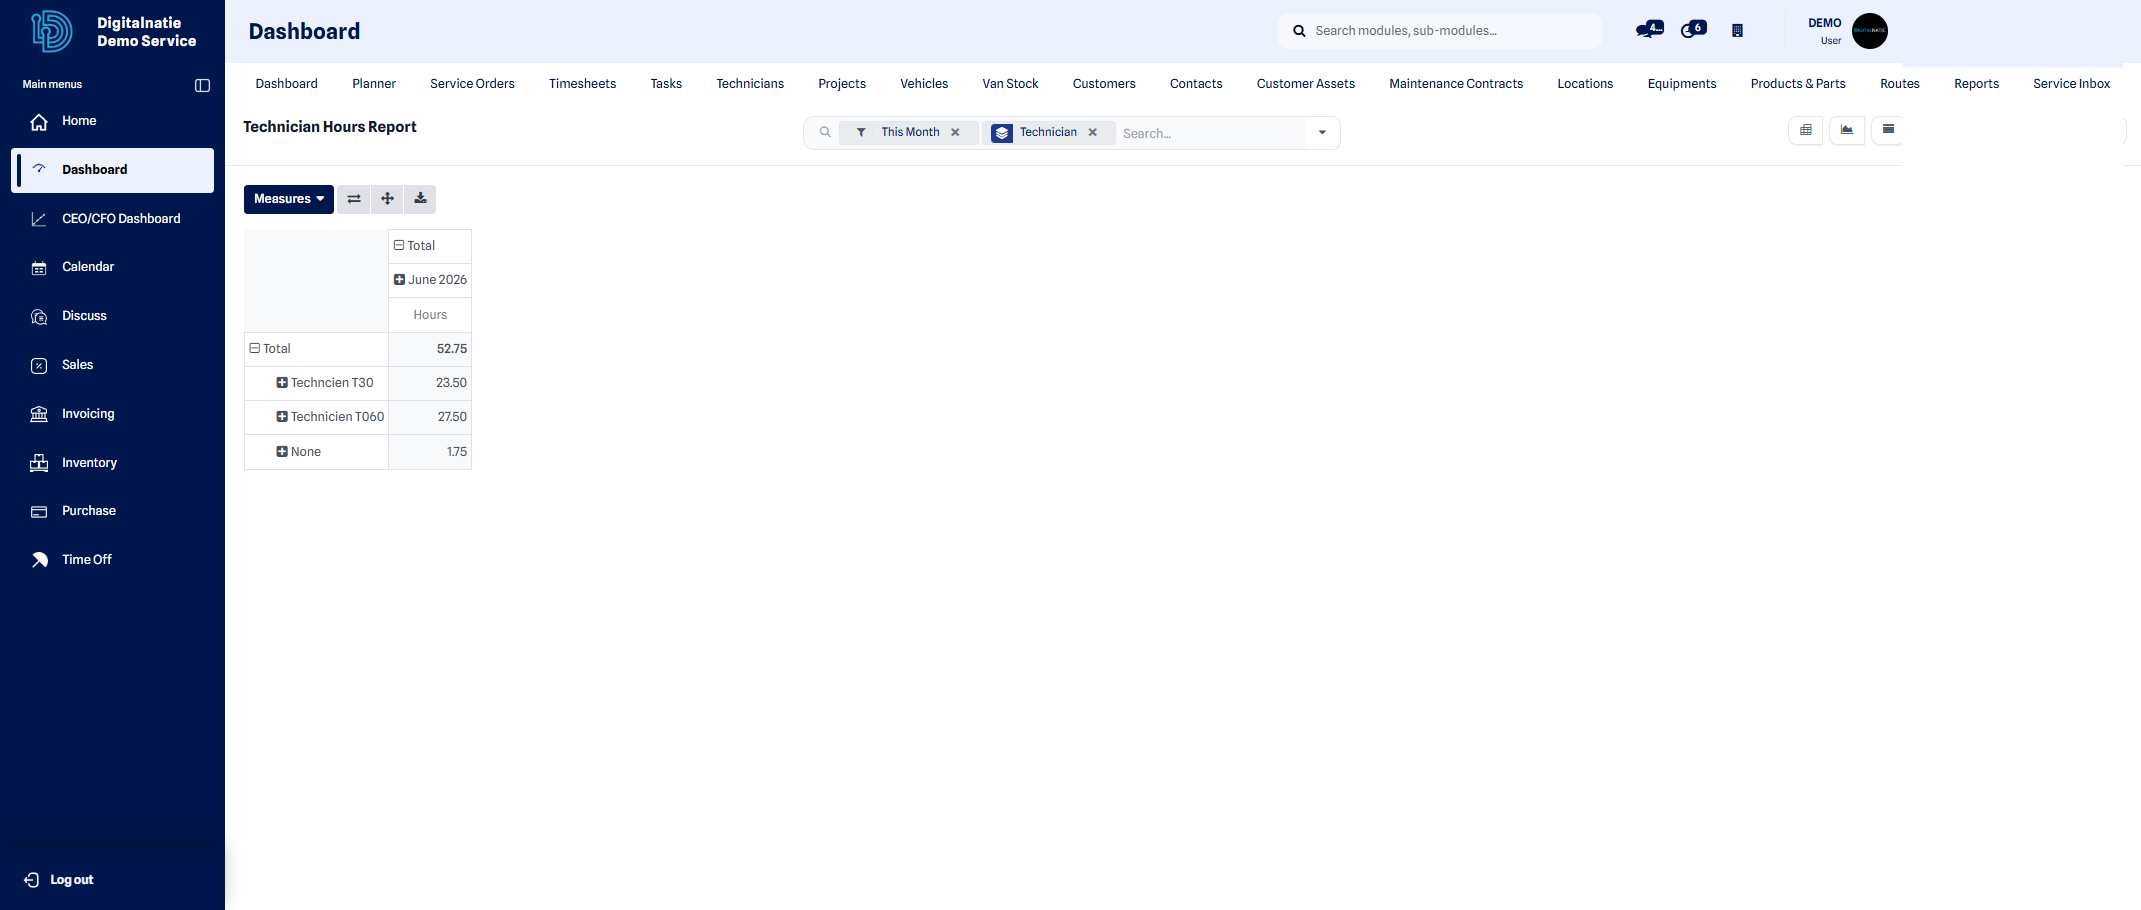 Analysis by technician: logged hours, completed interventions and variances.
Filter and group
Section titled “Filter and group”- Open the Reports page and choose the analysis you want.
- Apply filters (period, technician, customer, intervention type).
- Group the data by dimension (month, technician, intervention type).
- Switch between the chart, pivot table and list views.
Result: the report updates instantly and reflects exactly the filtered scope. You can then export it for external use.
Export
Section titled “Export”Reports can be exported (for example to a spreadsheet) to share or archive them.